Jörg Neugschwender
Pension system regulation has grown to a complex field of study. Nowadays, in most pension systems, many actors are setting up the institutional framework securing poverty prevention and income maintenance in old age (cf. OECD 2005; European Commission 2003; World Bank 1994). As a consequence, income security among the elderly is typically provided by an income mix from various pension schemes. In this introductory blog, I will give a brief overview about the conceptual distinction of individual pension schemes within an entire pension system. This section is followed by an argument on the relevance of cross-national studies for evidence-based policy advice. A third section will give an extended conceptual overview which is used throughout Inequality among the Elderly.
Pillars vs. tiers – the core conceptual framework for pension system design
Various typologies help to determine income security in old age. At this stage, I will briefly introduce the traditional concepts of pension pillars and income tiers. The concept of pension pillars distinguishes involved actors in regulation of pension systems: the state (first/public pillar), employers and trade unions (second/occupational pillar), and financial institutes (third/individual pillar). The concept of income tiers clarifies the functions/goals of pension income: poverty prevention and income maintenance. The first tier aims at providing a minimum income protection to prevent poverty (poverty prevention function); the second tier is linked to previous labour market earnings and pension entitlements through contributions. At retirement, these entitlements replace a certain level of the previous earnings (income maintenance function) and thus ensure pension adequacy (European Commission 2003). Third-tier pensions are an individual topping up of second-tier benefits.
What can we gain from cross-national comparisons?
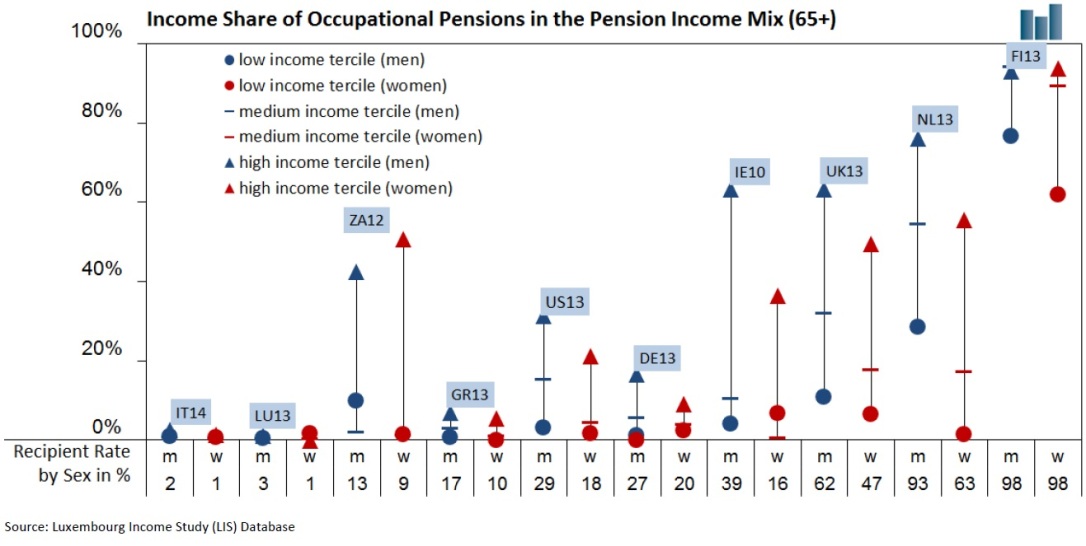
Institutional differences across various pension schemes, such as contribution rates, voluntary vs. mandatory coverage, eligibility criteria and benefit calculation, are essential sources that help to explain cross-national differences in the income mix, financial well-being, and inequality among the elderly. I believe that comparative studies of institutional differences and its outcomes provide an essential understanding about consequences of specific pension system paths of the past and potential future reform needs. For example, public second-tier schemes may crowd out or crowd in further mandated schemes by the state, employers, or trade unions. Thus, occupational pensions can work either as a substitute to public welfare state activity or as complementary welfare programmes. At the same time, occupational equivalents could possibly only provide selective coverage. As a result, cross-national studies of financial well-being among the elderly may reveal country-specific shortcomings in poverty prevention and pension adequacy. Such comparisons are not only informative, but also crucial for evidence-based policy advice.
However, national studies, which aim at adopting other country’s national experiences to their own national context, also need to carefully analyse comparability of the surroundings such as labour markets and individual labour market attachment, living arrangements, and other cultural differences. Blog entries in Inequality among the Elderly seek to also provide appropiate background statistics. Once these differences have been carefully considered, comparative studies on alternative pathways of pension policy and their outcomes are promising for national reform scenarios.
An extended conceptual framework for pension system design
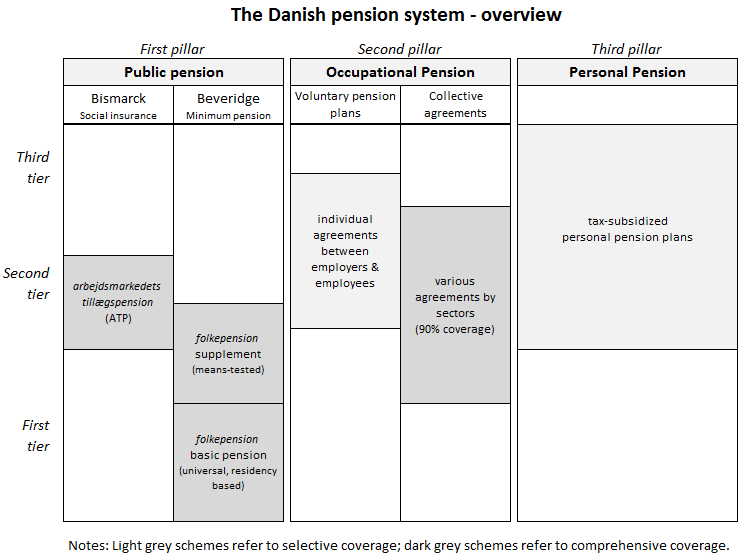
Researchers in the field have systematically analysed the development of multipillar pension systems and the variety of institutional arrangements between the policy actors (Arza and Kohli 2008; Ebbinghaus 2011; Natali et al. 2018). These scholars equally follow the traditional conceptual framework of pension pillars and income tiers. The extended conceptual approach, which is used thoughout blog entries in Inequality among the Elderly, integrates also the typology of Bismarckian vs. Beveridgean systems in this framework. Figure 1 summarises this extended framework for pension system design (see in detail Neugschwender 2016, 14-15).
Figure 1: Classification of Pension Systems
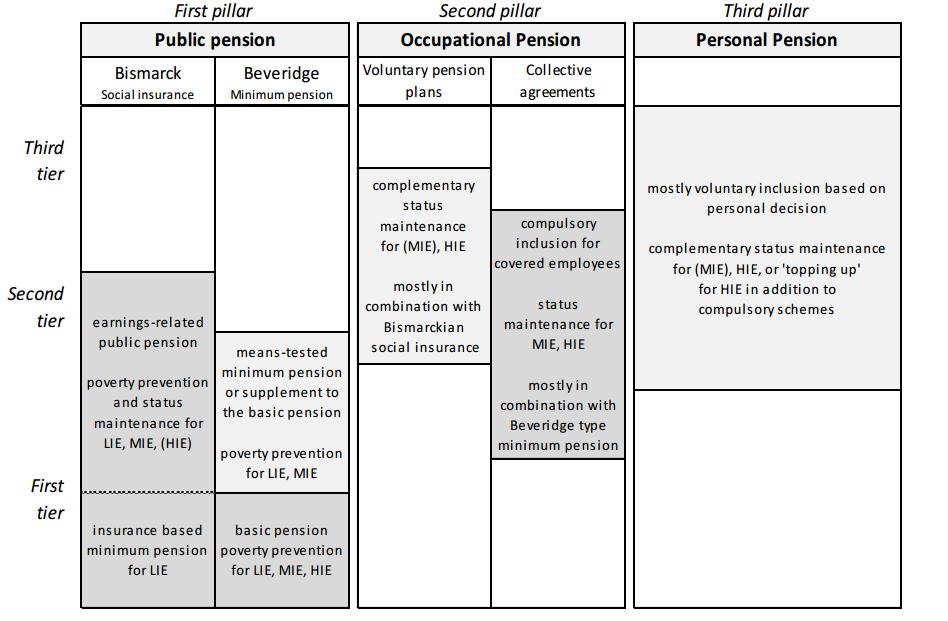
Notes: LIE=low-income earner; MIE=medium-income earner; HIE=high-income earner.
Light grey schemes refer to selective coverage; dark grey schemes refer to comprehensive coverage
First-pillar Bismarckian social insurance systems (for example Germany, Spain, Italy, and the United States) are earnings-related pension schemes that secure individuals with first and second-tier benefits for low to middle-income earners, and partly high-income earners, depending on the (non-)existence of contribution and/or income ceilings. In various contributory pension schemes, minimum pensions are also embedded (for example Estonia, Greece, Hungary, Mexico, Poland, Russia, and Spain); a full amount of the minimum pension is frequently granted only in case of reaching a minimum period of contributions. Contributory pension schemes typically cover the active population.
First-pillar schemes in a Beverigdean pension system can be categorised in two types: basic pensions and/or targeted means-tested pensions. Basic pensions aim at guaranteeing the first tier of pension income for the entire elderly population. For low-income earners, these benefits possibly could also guarantee their second tier of income, in case the level of the basic pension is relatively high. In contrast to this, minimum pension schemes can also be targeted to the poor (for example Australia, Finland, Italy Spain, the United States) or foresee a means-tested supplement to the basic pension (for example Canada, Denmark, and the United Kingdom). Depending on the generosity of the amount, these schemes provide first and second-tier benefits for low to middle-income earners. Such non-contributory schemes typically cover the whole resident population.
Next to the public first pillar schemes there are also schemes set up by individual employers, employer associations, or trade unions. Inclusion to these occupational second-pillar pensions is strongly determined by the obligation to participate in these schemes. In cases when occupational pensions were kept mostly on voluntary decision basis by employers and individuals, this approach was frequently combined with a Bismarckian social insurance system (for example Germany, Italy, the United States). In contrast to this, countries that designed their public pension scheme to protect the poor only, frequently introduced collective agreements between employers and employees. Thus, most initial Beveridge type pensions have developed towards Beveridge + Bismarck systems (Ebbinghaus and Gronwald 2011). Comprehensive coverage with second-tier earnings-related schemes is reached through ergaomnes regulations in collective agreements, for example in the Netherlands, Denmark, and Sweden, or in the case of Finland by tripartite legislation of employers, trade unions, and the government. Yet a different pathway exists in the United Kingdom and Japan, where mandatory contributions to a state second tier can be contracted out to private plans.
Individual third-pillar pensions can be considered a more recent development that gained further importance in the course of reforms to Bismarckian social insurance systems. Traditionally, personal pensions were mostly voluntary tax favoured savings plans offered by financial institutes. Nowadays, more and more state influence in the design of third-pillar arrangements can be observed. In recent reforms, former contributions to the public system are transferred to private sector pension funds or similar investments. This transformation may include a switch from voluntary to mandatory contributions; the most notable example in Europe is the case of the premium pension in Sweden. However, recent reforms in Latin America and Eastern Europe signify that pension privatisation is not a one-way development; in various countries, previous extensions have been also reversed recently (Ortiz et al. 2018).
References
Arza, C., and Kohli, M. (eds.) (2008a). Pension Reform in Europe. Politics, Policies and Outcomes. London/New York: Routledge.
Ebbinghaus, B. (ed.) (2011). The Varieties of Pension Governance: Pension Privatization in Europe. Oxford: Oxford University Press.
Ebbinghaus, B., and Gronwald, M. (2011). ‘The Changing Public–Private Pension Mix in Europe: From Path Dependence to Path Departure’, in B. Ebbinghaus (ed.), The Varieties of Pension Governance: Pension Privatization in Europe. Oxford: Oxford University Press, 23-53.
European Commission (2003). Adequate and sustainable pensions – Joint report by the Commission and the Council, Luxembourg, Publications Office.
Natali, D., and Pavolini, E. with Vanhercke, B. (2018). Occupational Welfare in Europe: Risks, opportunities and social partner involvement. ETUI, Brussels, OSE, Brussels.
Neugschwender, J. (2016). Pension Systems and Income Inequality among the Elderly in Europe, Mannheim [Dissertation],https://ub-madoc.bib.uni-mannheim.de/41262/.
OECD (2005). Pensions at a Glance. Public Policies across OECD Countries. Paris: OECD Publishing.
Ortiz, I., Durán-Valverde, F., Urban, S., Wodsak, V., Yu, Z. (2018). Reversing Pension Privatization: Rebuilding public pension systems in Eastern European and Latin American countries (2000-18), ESS Working Paper No. 63, Geneva, ILO.
World Bank (1994). Averting the Old Age Crisis: Policies to Protect the Old and Promote Growth. Washington D.C.: The World Bank.